HAROLD WASHINGTON LIBRARY

Chicago Building ID: 157964
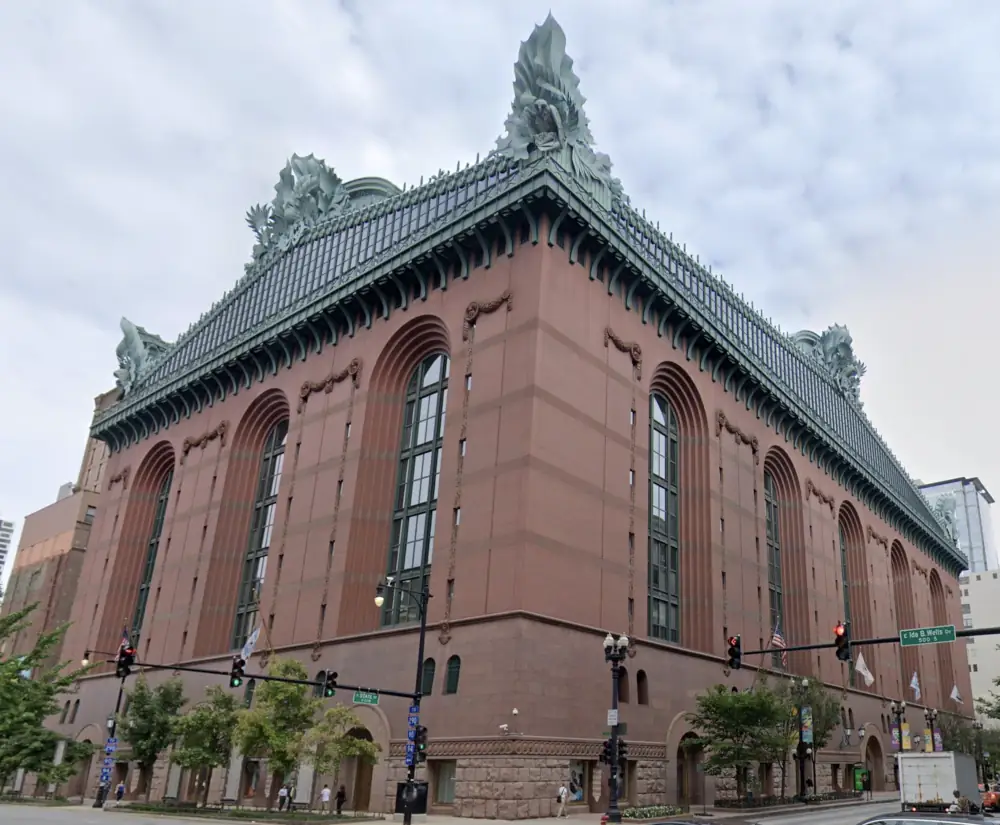
Attribution: © Google 2026
Building Info
- Square Footage
- 756,640 sqft#1 Largest of LibrarysHigher than 94% of all buildings6x median124,364 sqft5x median Library146,470.5 sqft
- Built
- 1991
- Primary Property Type
- Library
- Community Area
- Loop
- Ward
- 4
-
Chicago Energy Rating
- 1.0 / 4
- Owner

Note: Owner manually tagged. Logo used under fair use.
2023 Report Card
Debug Full Grade Data
- AvgPercentileLetterGrade: C
- AvgPercentileGrade: 54.2924382778877
- GHGIntensityLetterGrade: F
- GHGIntensityPercentileGrade: 8.631415241057539
- EnergyMixLetterGrade: A
- EnergyMixWeightedPctSum: 100.0
- EnergyMixPercentileGrade: 99.94182664339732
- SubmittedRecordsLetterGrade: A
- MissingRecordsCount: 0.0
- SubmittedRecordsPercentileGrade: 100.0
Emissions & Energy Information for 2023
- Greenhouse Gas Intensity F
- 11.1 kg CO2e / sqftHigher than 91% of all buildings1.8x median6.2 kg CO2e / sqft1.1x median Library10.2 kg CO2e / sqft
- Total Greenhouse Gas Emissions
- 8,379 tons CO2e#1 Highest of Librarys 🚨Higher than 97% of all buildings10x median841.4 tons CO2e7x median Library1,190.8 tons CO2e
Years Reported
10/10
A


2014
2015
2016
2017
2018
2019
2020
2021
2022
2023
Energy Breakdown for HAROLD WASHINGTON LIBRARY
- Fossil Gas Use (aka Natural Gas)
- This Building Didn't Burn Any Fossil Gas! 🎉
This building hasn't reported burning fossil gas on-site and isn't connected to a district heating system, meaning it's fully electric!
View All of Chicago's All Electric Buildings - Electricity Use
- 59,888,198 kBtuEst. Electric Bill: $2,510,000 for 2023**#1 Highest of Librarys 🚨Higher than 98% of all buildings17x median3,580,332.6 kBtu12x median Library5,102,925.2 kBtu
Energy Mix A
Total Energy Use: 59,888,199 kBTU
Scan To Learn More
https://electrifychicago.net/building/157964
View Extra Technical & Historic Info
- Source Energy Usage Intensity
- Not Reported
This data was not reported for this building this year, which likely means a value of zero for this field.
- Site Energy Usage Intensity
- Not Reported
This data was not reported for this building this year, which likely means a value of zero for this field.
Full Historical Data Table for HAROLD WASHINGTON LIBRARY
| Year |
Overall Grade |
Emissions Intensity Sub-Grade |
Energy Mix Sub-Grade |
Reporting Mix Sub-Grade | GHG Intensity kg CO2e / sqft | GHG Emissions metric tons CO2e | Energy Mix | Electricity Use kBTU | Source EUI kBTU / sqft | Floor Area sqft |
Chicago Energy Rating |
|---|---|---|---|---|---|---|---|---|---|---|---|
| 2014 | C | F | A | A | 19.23 | 14,549 | 100%Electricity 0%Fossil Gas 0%Other | 72,412,262 | 301 | 756,640 | - |
| 2015 | C | F | A | A | 18.9 | 14,323 | 100%Electricity 0%Fossil Gas 0%Other | 71,288,656 | 295.8 | 756,640 | - |
| 2016 | C | F | A | A | 15.8 | 11,955 | 100%Electricity 0%Fossil Gas 0%Other | 64,863,144 | 269.2 | 756,640 | - |
| 2017 | C | F | A | A | 15.6 | 11,814 | 100%Electricity 0%Fossil Gas 0%Other | 63,897,002 | 265.2 | 756,640 | - |
| 2018 | C | F | A | A | 14 | 10,580 | 100%Electricity 0%Fossil Gas 0%Other | 63,600,294 | 235.4 | 756,640 | 2.0 |
| 2019 | C | F | A | A | 14.1 | 10,678 | 100%Electricity 0%Fossil Gas 0%Other | 64,190,058 | 237.5 | 756,640 | 2.0 |
| 2020 | C | F | A | A | 12.2 | 9,208 | 100%Electricity 0%Fossil Gas 0%Other | 58,999,213 | 218.3 | 756,640 | 1.0 |
| 2021 | C | F | A | A | 11.7 | 8,853 | 100%Electricity 0%Fossil Gas 0%Other | 61,987,135 | 229.4 | 756,640 | 1.0 |
| 2022 | C | F | A | A | 11.4 | 8,609 | 100%Electricity 0%Fossil Gas 0%Other | 65,367,156 | 241.9 | 756,640 | 1.0 |
| 2023 | C | F | A | A | 11.1 | 8,379 | 100%Electricity 0%Fossil Gas 0%Other | 59,888,199 | 221.6 | 756,640 | 1.0 |
* Note on Rankings: Rankings and medians are among included buildings, which are those who reported under the Chicago Energy Benchmarking Ordinance for the year 2023, which only applies to buildings over 50,000 square feet.
** Note on Bill Estimates:
Estimates for gas and electric bills are based on average electric and
gas retail prices for Chicago in 2021 and
are rounded. We expect large buildings would negotiate lower rates with
utilities, but these estimates serve as an upper bound of cost and help
understand the volume of energy a building is used by comparing it to
your own energy bills! See our
Chicago Gas & Electric Costs Source
for the original statistics.
Data Source:
Chicago Energy Benchmarking Data